In spite of the heavy rain, many alumni joined us for an alumni donor appreciation crawfish boil on the afternoon of
Is resistance or resilience a better response to a cyclone?
Mon, 03/07/2022 - 10:02am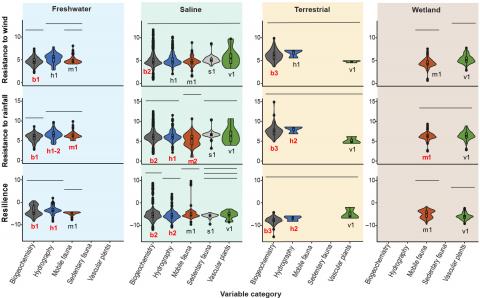
Top Stories
Students Sink Teeth into New Science Museum Exhibit
A new exhibit opening 1 May 2026 at the University of Louisiana at Lafayette Science Museum is putting student creat
Drs. Kelly Robinson and Beth Stauffer from our Biology Department along with an international team of some 47 other researchers published an interesting new study of the ecological impacts of tropical cyclones, to address a question that people have asked for centuries: When confronted by a storm, is it better to be resistant like an oak or resilient like a willow? You can find the details in the Science Advances paper A general pattern of trade-offs between ecosystem resistance and resilience to tropical cyclones. The findings could help guide managers as they plan for climate change and a growing coastal population threatened by more intense tropical storms. In the study, researchers used pre- and post-storm monitoring surveys to analyze patterns of ecosystem resistance and resilience from 26 Northern Hemisphere storms. These made landfall between 1985 and 2018 in states from Texas to North Carolina, as well as in Puerto Rico and Taiwan. The research is funded by the National Science Foundation.
x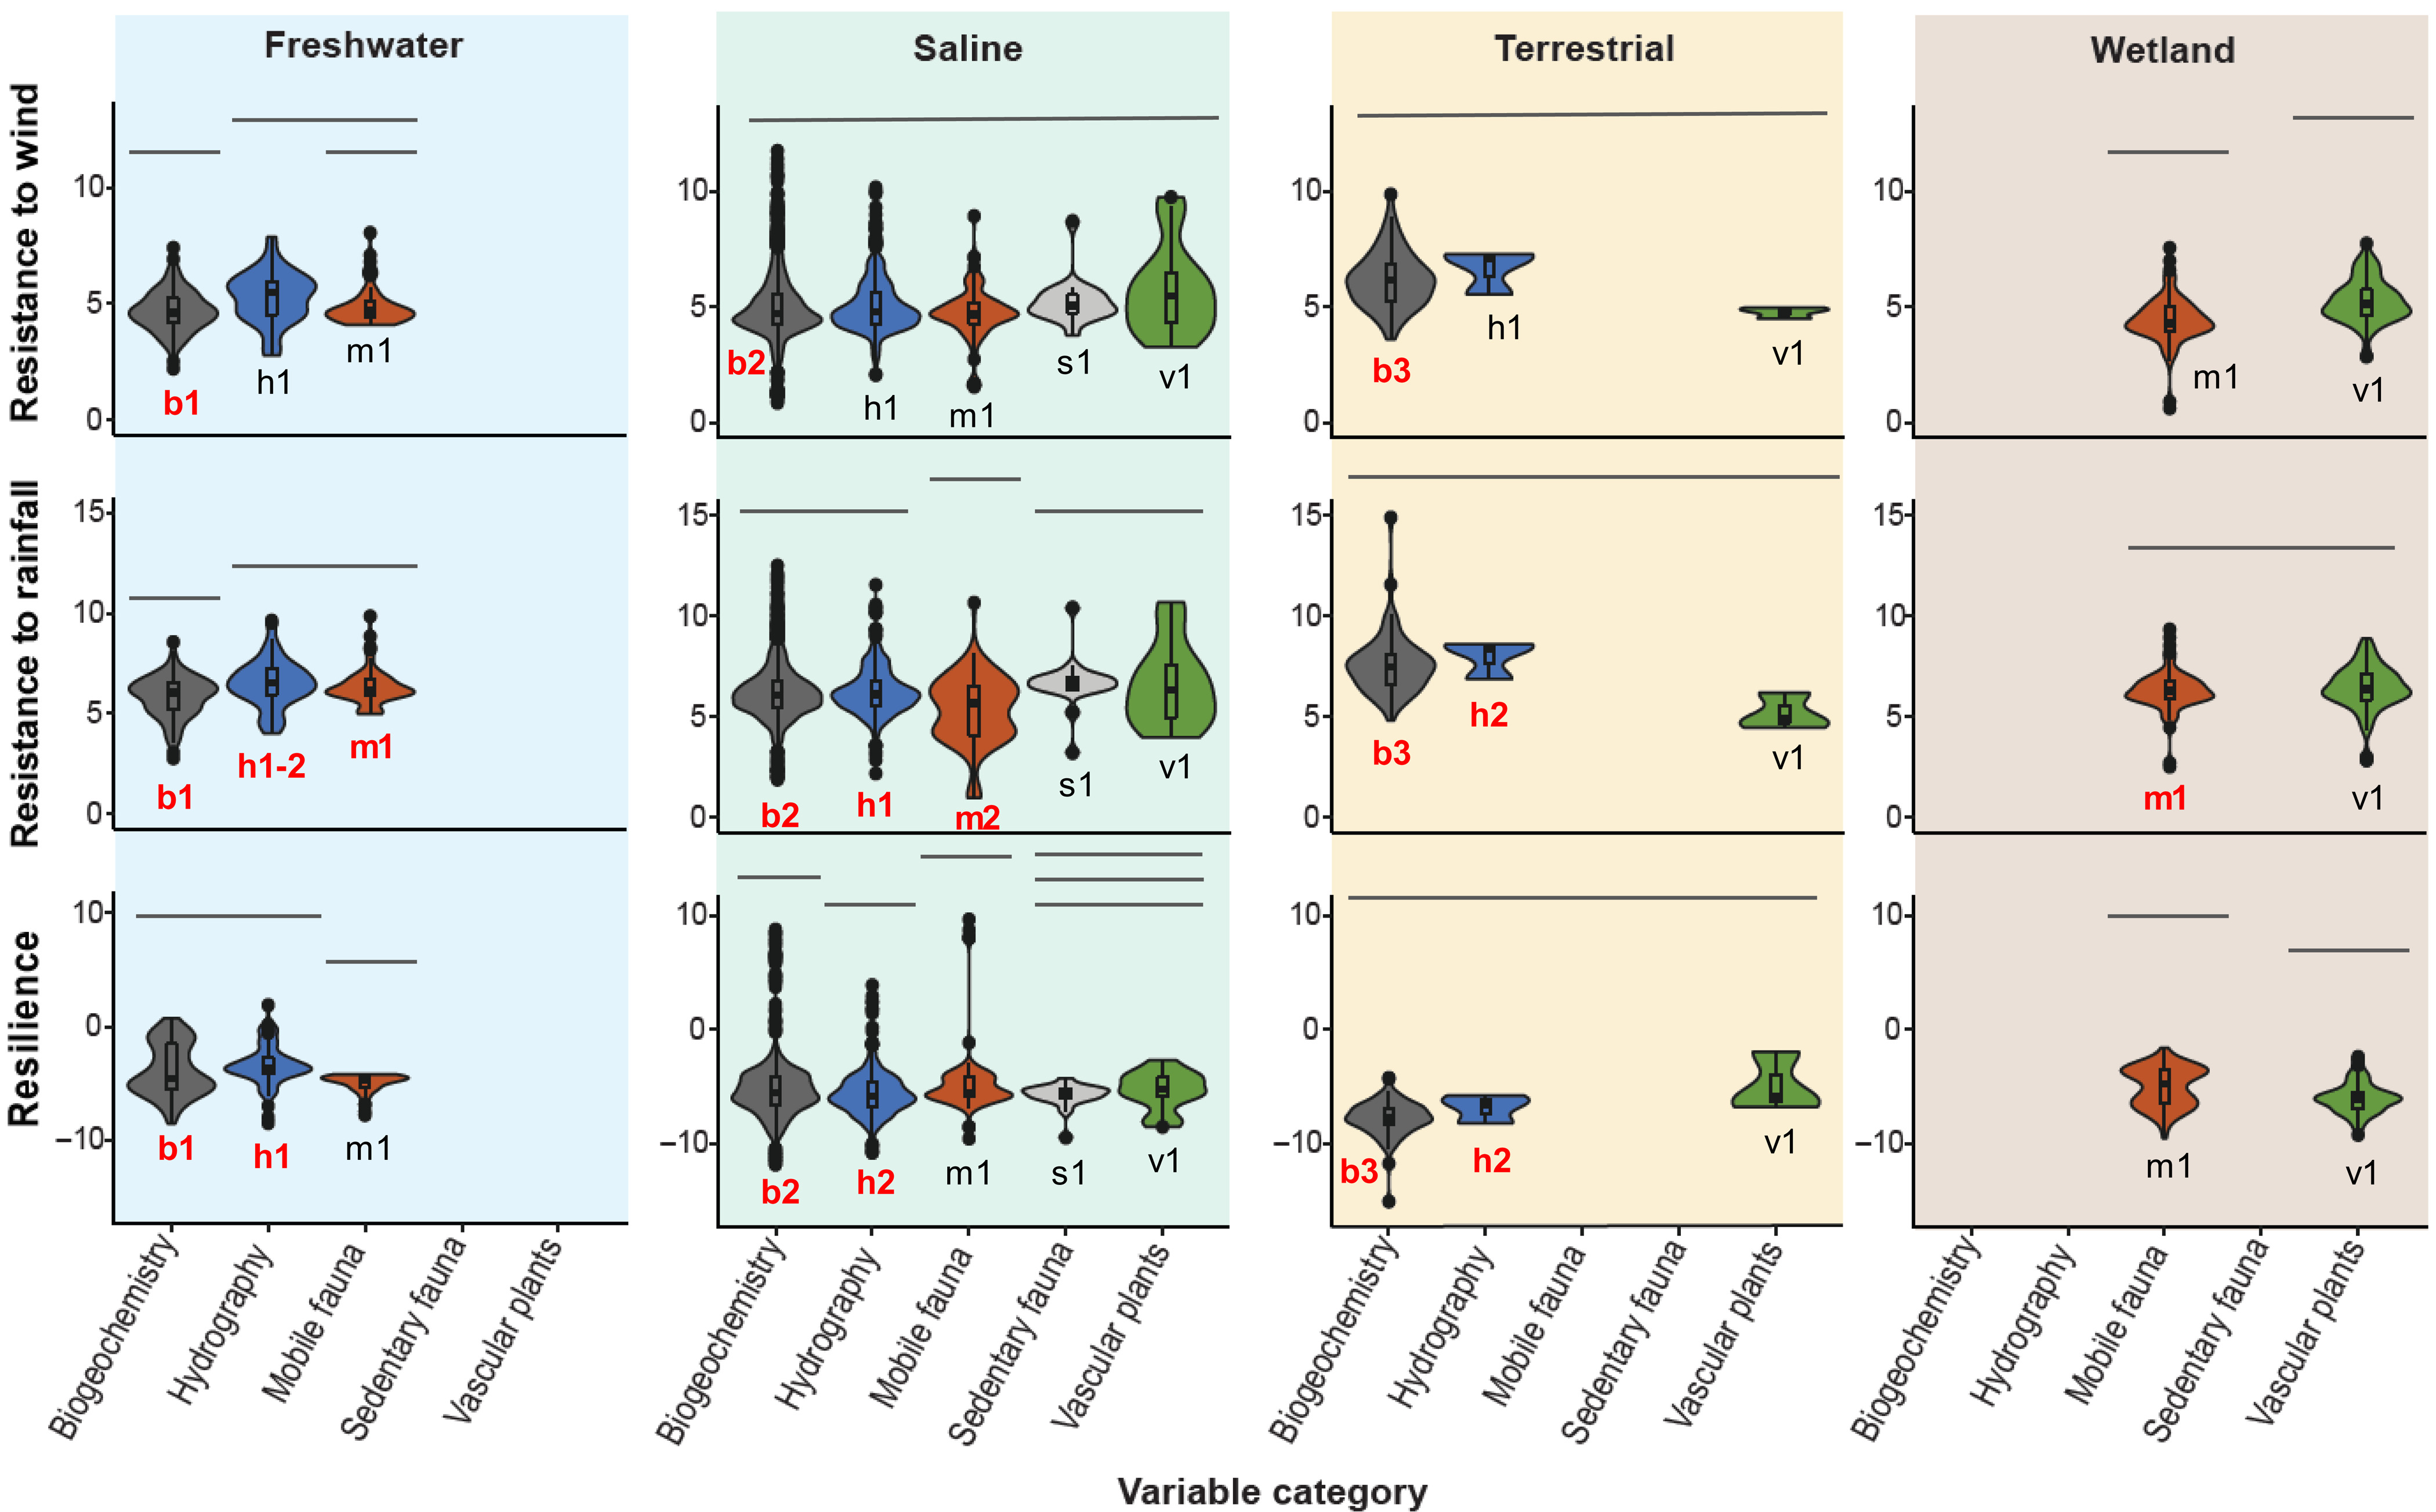
Figure Caption Comparison of resistance and resilience among variable categories within ecosystem types. Columns correspond to ecosystem type, rows correspond to response metric, and colors denote variable category. Violin plots show the distribution of data within each group, while inset box plots show the median, quartiles, and outliers (points). Bars over each plot indicate which variables are not significantly different from one another within ecosystems. Alphanumeric labels under each violin plot indicate which variable categories were significantly different among ecosystems (columns). Letter denotes variable category (e.g., b = biogeochemistry, h = hydrography, m = mobile fauna, s = sedentary fauna, v = vascular plants). Number denotes rank, with different numbers across plots (e.g., b1 versus b2) indicating a significant difference. Red text indicates that for the response variable (row) and the indicated variable category (letter), we observed significant differences among ecosystem types (table S4).